Connecting the CubeGrid with Pentaho Mondrian, JasperReports and Microsoft Analysis Services
Why use the CubeGrid?
Popular Online Analytical Analytical Processing (OLAP) server technologies such as Pentaho Mondrian Project, JasperReports, and Microsoft SQL Server Analysis Services (SSAS) enable business users to analyze large quantities of data, offering features such as drilling into and cross-tabulating information from complex analytical queries in real-time. However, the default user interfaces (UIs) are limited, and it can be difficult or impossible to add the additional behaviors that are typically needed when integrating with a larger application. Connecting CubeGrid APIs to these multidimensional, or ‘cube’, data sources will allow you to:
- Create more powerful and higher performance UI to replace the built-in UIs, and
- Seamlessly integrate custom OLAP interfaces into your larger applications.
The CubeGrid is a high-end data analysis engine that wraps OLAP functionality into a single Smart GWT or SmartClient interactive grid component for fast access to multidimensional data and calculations. Please see our previous blog post, Introducing the CubeGrid, for more information about the advanced OLAP features in our Analytics Module.
This article explains how to connect the CubeGrid user interface to several common sources of cube data using MDX, XMLA, and OLAP4J.
- MDX (MultiDimensional eXpressions) is a query language for multidimensional databases, in the same way SQL is used to query relational databases.
- XMLA (XML for Analysis, or XML/A) is a Simple Object Access Protocol (SOAP)-based XML protocol, designed specifically for universal data access to any standard multidimensional data source.
- OLAP4J is an open Java API for OLAP, similar to JDBC, but specifically created to access multidimensional datasets.
Server Technology Overview
- Pentaho Mondrian Project (Community Edition) is an open source OLAP server written in Java and available under the Eclipse Public License (EPL). Mondrian enables interactive analysis of very large datasets stored in SQL databases without writing SQL. It supports the MDX (multidimensional expressions) query language, plus the XMLA and OLAP4J interface specifications. It reads from SQL (and other data sources) and aggregates data in a memory cache.
- JasperReports Server (Community Edition) is an open source, stand-alone and embeddable OLAP reporting server written in Java and available under the GNU General Public License (GPL). JasperReports Server enables delivery of information on a real-time or scheduled basis to the web, printers, or a variety of file formats, including; PDF, HTML, Microsoft Excel, RTF, ODT, XML, or comma-separated values. JasperReports Server uses the same Mondrian OLAP engine as Pentaho Mondrian Project, and can be integrated with the CubeGrid using a similar methodology.
- Microsoft SQL Server Analysis Services (SSAS) is available as a part of Microsoft SQL Server, a proprietary RDBMS written in C++ and sold in a wide variety of commercial and free editions. SQL Server Analysis Services adds OLAP and data mining capabilities for SQL Server databases. Microsoft’s OLAP engine supports MOLAP, ROLAP and HOLAP storage modes for data, and supports the XMLA standard as the underlying communication protocol. Cube data can be accessed using MDX and LINQ queries, and data mining specific functionality is exposed via the DMX query language.
OLAP Server | Company | Version | Language | License |
Pentaho Mondrian Server | 3.4.0 | Java | ||
JasperReports Server | 4.5.0 | Java | ||
Microsoft SQL Server | 2012 | C++ |
Connecting the CubeGrid
Multidimensional data sets are called Data Cubes, which consist of features or attributes called Dimensions. Each corresponding Dimension will also have feature values or attribute values called Members. These definitions have analogous nomenclature in the CubeGrid, as shown in the table below:
OLAP | CubeGrid | Definition |
Data cube | Cube | Multidimensional dataset |
Dimension | Facet | Dimension, attribute, or feature |
Member | Facet value | Dimension member, attribute value, or feature value |
On the server side, we first need to set up our DataSources to fetch the necessary data. We have four Java Classes for our DataSources:
- OLAPDataSourceCubes gets all available Data Cubes in the OLAP database.
- OLAPDataSourceDimensions gets all available Dimensions for the selected Data Cube (for placement on rows or columns in the CubeGrid).
- OLAPDataSourceMembers gets all available Members for the selected Dimension, with only one call to the server.
- OLAPDataSource gets all available data with a query based on the MDX Object Model.
The selected Data Cube and Dimensions are sent from client to server as criteria obtained from DSRequest.
Lastly, the DBConnection Java Class is required for connection to the chosen OLAP server. There are three variations of the getConnection() method:
- getConnection() creates an OLAP connection to Mondrian server by default. For this example, we used the “FoodMart” sample dataset included with Mondrian.
- getConnectionJasper() creates an OLAP connection to JasperReports Server. To use this method, first rename getConnectionJasper() to getConnection(). For this example, we used the sample dataset included with JasperReports Server.
- getConnectionAServices() creates an OLAP connection to Microsoft Analysis Services. To use this method, first rename getConnectionAServices to getConnection(). For this example, we used the Adventure Works samples referenced below.
On the client side, we already have the code required to interface with the CubeGrid. This is very similar to the Advanced Cube sample in the Showcase, except that Data Cubes, Dimensions and associated Members are fetched dynamically.
The software versions used in this sample are:
- Driver Olap4j, version 1.0.0.445
- Pentaho Mondrian, version 3.2.1.13885
- JasperReports Server, version 4.1.0
- Windows Server 2003 with Analysis Services R2 2008 using the Adventure Works 2008R2 Analysis Services Project sample, and AdventureWorksDW2008R2 sample database
Download the project source code used in the examples here.
Examples
Lastly, we’ll show a few images of the Project in action.
Figure 1: Creating the CubeGrid from a connected OLAP server (from left to right)
- Opening screen for Data Cube selection
- Select Data Cube from the OLAP Server
- Select Dimensions (Facets) of the Data Cube for placement on rows and columns
- Select ‘Create CubeGrid’

Figure 2: The newly created CubeGrid with Control Panel for Dimension (Facet) manipulation
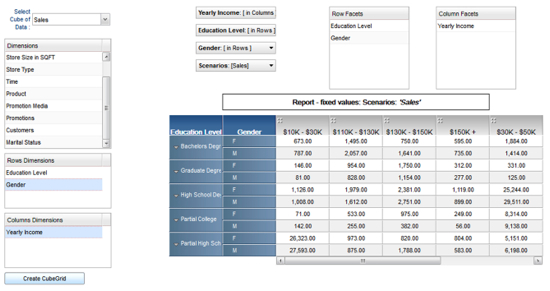
Figure 3: View Members (Facet Values) of selected Dimensions (Facets) using the Control Panel
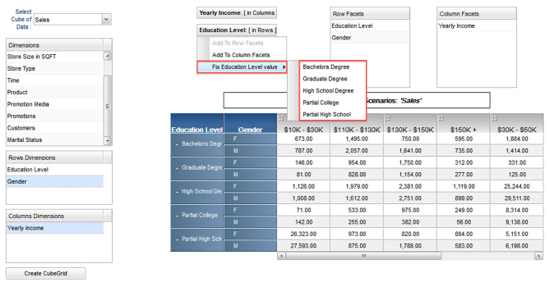
Figure 4: Reposition Dimensions (Facets) on the fly for alternate views

Note that the UI shown above is built out of ordinary Smart GWT components such as ListGrids and Menus (and of course the CubeGrid). This means that, unlike the pre-built UIs bundled with OLAP products, the UI shown above can be easily rearranged and extended. For example, you could add context menus that launch application-specific actions when the user right-clicks on data or dimension values.
Please Note: Some Dimensions in the test cubes are very large and not collapsible due to their non-hierarchical nature. For example, the ‘Customers’ dimension in the ‘Sales’ cube sample for Mondrian shows all values. As a result, the cube may become difficult to navigate or show a slow scripts browser warning. The recommended way to avoid this is to require that the end user choose specific members from large dimensions before adding them to the cube.
Pre-requisites
- The sample application shown above is open source and free to use. You can download the project source code used in the examples here.
- The CubeGrid component requires the Power Edition or above with our optional Analytics Module. For more information about our editions and optional modules, please visit our Product Overview page.