R Integration
- Isomorphic Support
R Integration Overview
R is a language and environment for statistical computing and graphics. It is used in many industries to analyze and visualize what are often very large datasets. For a more detailed overview see http://www.r-project.org/
We want to make it easy to interface SmartClient and SmartGWT applications with the R environment so that data available in the web application tier can be sent to R for analysis and the outputs of this analysis (whether text or graphical) can be made available to the web tier for post processing and ultimate display to the end user - in short to make it easy to use R with all its power in your application.
Here we present a ready-to use example of this sort of integration in the form of a web interface that drives the generation of a sophisticated stock chart leveraging a third party library written natively in R. The key components here are:
- SmartClient or SmartGWT
- R installed on some server
- The quantmod R module (for stock data lookup and chart generation)
- The Rserve R module (part of the Java->R interface)
- The rJava library (part of the Java->R interface)
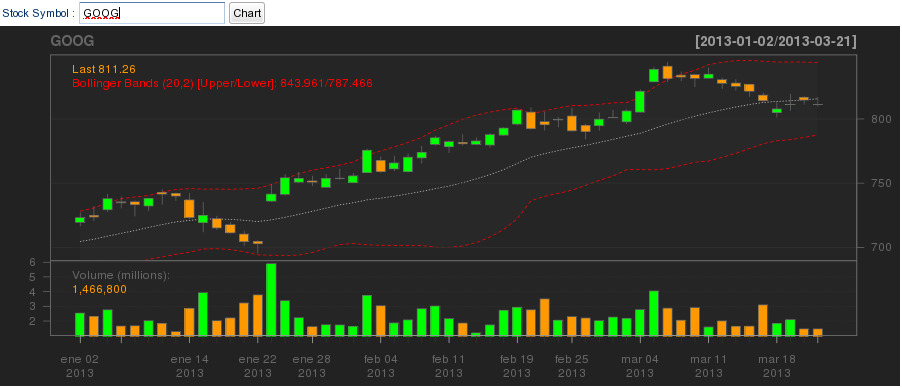
In the example below, we create a form that takes a stock ticker that is sent to the server along with the current size of the chart image. This data is processed by a standard DataSource that uses JSR223 as a bridge to execute R code embedded directly in the DataSource. This R script is sent via rJava to the Rserve module running in the R environment for execution and the results (a binary chart in this case) are streamed back to the browser for display.
With this, we think you should be able to use R in your own SmartClient/SmartGWT applications - let us know how it goes! We would love to hear how you use this...
SmartClient with R
This sample uses the ChartPane.js and RChart.js scripts as the client-side code, and the RChartDS.ds.xml as the dataSource:
isc.defineClass("ChartPane", "VLayout").addProperties({
formDefaults: {
    _constructor: "DynamicForm",
    width: 200,
    wrapItemTitles: false,
    autoFocus: true,
    itemKeyPress: function (item, keyName, characterValue) {
        if (keyName == "Enter") this.creator.updateChart();
    },
    numCols: 3,
    items: [
        {name: "stockSymbol", title: "Stock Symbol", defaultValue: "GOOG"},
        {name: "Chart", type: "button", click: "form.creator.updateChart()", startRow: false}
    ]
},
updateChart : function () {
    this.rChart.setCriteria(this.form.getValues());
},

rChartDefaults: {
    _constructor: "RChart",
    name: "stockChart",
    width: "900",
    height: "360"
},
autoChildren: ["form", "rChart"],

initWidget : function () {
    this.Super("initWidget", arguments);


    this.addAutoChildren(this.autoChildren);
    this.updateChart();
}
});
isc.defineClass("RChart", "Img").addProperties({
imageType: "normal",
initWidget : function () {
    //this.doSetSrc();
    this.Super("initWidget", arguments);
},
resized : function () {
    this.doSetSrc();
    this.resetSrc();
},
draw : function () {
    this.Super("draw", arguments);
    this.doSetSrc();
    this.resetSrc();
},
getCriteria : function () {
    // clone any criteria passed to us initially (don't scribble on user-provided object)
    var criteria = isc.addProperties({}, this.criteria);

    isc.addProperties(criteria, {
        name: this.name,
        // coerce to string for passing to REngine
        width: this.getVisibleWidth()+"",
        height: this.getVisibleHeight()+""
    });
    return criteria;
},
setCriteria : function (criteria) {
    this.criteria = criteria;

    this.doSetSrc();
    this.resetSrc();
},

doSetSrc : function () {
    this.src = RChartDS.getFetchDataURL(this.getCriteria(), {operationId: "getChart"});
}
});
<DataSource
    ID="RChartDS"
>
    <fields>
        <field name="name" primaryKey="true"/>
    </fields>

    <operationBindings>
      <operationBinding operationType="fetch" operationId="getChart">
          <script language="groovy"><![CDATA[
            def chartRequest = new DSRequest("RChartDS", "fetch", rpc);

            // create a unique string for the temporary file used for the R-generated image
            criteria.tmpFilename = "/tmp/"+criteria.name+"_"+UUID.randomUUID()+".png";

            def chartResponse = chartRequest.setCriteria(criteria)
                                            .setOperationId(criteria.name)
                                            .execute();
            rpc.doCustomResponse();
            requestContext.setContentType("image/png");
            def os = response.getOutputStream();
            os.write(chartResponse.data);
            os.flush();
          ]]></script>
      </operationBinding>
      <operationBinding operationType="fetch" operationId="stockChart">
          <script language="REngine"><![CDATA[
            library('quantmod')

            png(filename=criteria$tmpFilename, height=as.numeric(criteria$height), width=as.numeric(criteria$width))

            symbols <- getSymbols(criteria$stockSymbol, auto.assign=FALSE)
            chartSeries(symbols, name=criteria$stockSymbol, subset='last 3 months', TA="addVo();addBBands()")

            # Turn off device driver (to flush output to png)
            dev.off();

            # Read the generated image, delete it and return the binary stream
            returnVal <- readBin(criteria$tmpFilename,'raw',1024*1024);
            unlink(criteria$tmpFilename);
            returnVal;
          ]]></script>
      </operationBinding>
    </operationBindings>
</DataSource>
Finally, this is the code in the .html:
<SCRIPT SRC="../../isomorphic/DataSourceLoader?dataSource=RChartDS"></SCRIPT>
<SCRIPT src="scripts/ChartPane.js"></SCRIPT>
<SCRIPT src="scripts/RChart.js"></SCRIPT>
<SCRIPT>
isc.ChartPane.create({
    ID : "chartPane",
    width: "100%",
    height: "100%"
});
</SCRIPT>
This screenshot shows you the sample in action:
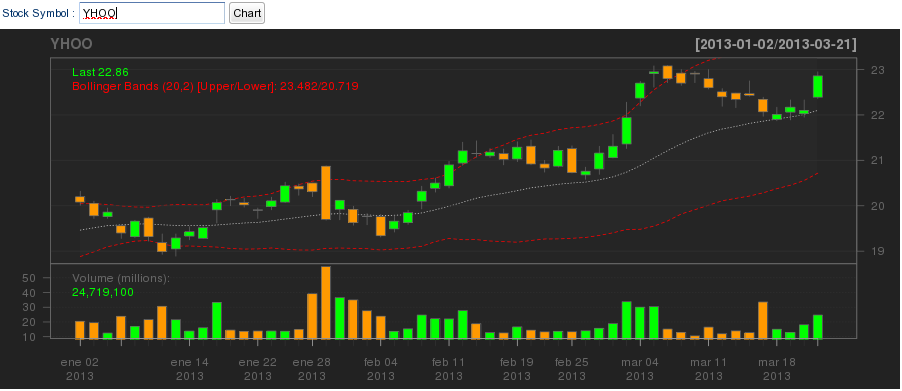
SmartGWT with R
The client-side code of this sample is the following:
public void onModuleLoad() {
    ChartPane chartPane = new ChartPane();
        chartPane.draw();
    }
    class ChartPane extends VLayout {
        private RChart rChart;
        private DynamicForm form;
        private Criteria criteria;

        public ChartPane () {
            this.form = new DynamicForm();
            this.form.setWidth(200);
            this.form.setWrapItemTitles(false);
            this.form.setAutoFocus(true);
            this.form.setNumCols(3);
            TextItem text = new TextItem();
            text.setName("stockSymbol");
            text.setTitle("Stock Symbol");
            text.setDefaultValue("YHOO");
            ButtonItem button = new ButtonItem();
            button.setTitle("Chart");
            button.setStartRow(false);
            button.addClickHandler(new ClickHandler() {
                @Override
                public void onClick(
                        com.smartgwt.client.widgets.form.fields.events.ClickEvent event) {
                    updateChart();
                }
            });
            this.form.setItems(text, button);

            this.form.addItemKeyPressHandler(new ItemKeyPressHandler() {
                @Override
                public void onItemKeyPress(ItemKeyPressEvent event) {
                    if (event.getKeyName().equalsIgnoreCase("Enter")) {
                        updateChart();
                    }
                }
            });

            this.rChart = new RChart();
            this.criteria = new Criteria();
            this.criteria.addCriteria("name", "stockChart");
            this.criteria.addCriteria("stockSymbol", this.form.getValueAsString("stockSymbol"));
            this.criteria.addCriteria("width", "900");
            this.criteria.addCriteria("height", "360");
            this.rChart.setCriteria(criteria);

            this.addMembers(form, rChart);
        }

        private void updateChart () {
            this.criteria.addCriteria("stockSymbol", this.form.getValueAsString("stockSymbol"));
            this.rChart.setCriteria(criteria);
        }
    }

    class RChart extends Img {
        Criteria criteria = new Criteria();

        public RChart () {
            this.setImageType(ImageStyle.NORMAL);
            this.setName("stockChart");
            this.setWidth("900");
            this.setHeight("360");
            this.doSetSrc();
            this.resetSrc();
        }

        private void doSetSrc() {
            DataSource ds = DataSource.get("RChartDS");
            DSRequest properties = new DSRequest();
            properties.setOperationId("getChart");
            this.setSrc(ds.getFetchDataURL(this.getCriteria(), properties));
        }
        private void setCriteria(Criteria criteria) {
            this.criteria = criteria;
            this.doSetSrc();
            this.resetSrc();
        }
        private Criteria getCriteria() {
            return this.criteria;
        }
    }
This screenshot shows you the sample in action:
Either SmartClient or SmartGWT sample uses the same .ds.xml as the dataSource.
Installing the R engine and the packages needed.
1.- Directions for installing R: http://www.r-project.org/
2.- After installing R, run it and install the following packages:
2.1.- quantmod:
install.packages("quantmod")
2.2.- Rserve. Further information: http://www.rforge.net/Rserve/
install.packages("Rserve")
2.3.- rJava (JRI). Further information: http://rforge.net/JRI/
install.packages("rJava")
3.- Download the libraries needed:
Rserve: JRS.jar, REngine.jar, RserveEngine.jar
JRI: JRS.jar, REngine.jar, JRI.jar, JRIEngine.jar
Further information: http://www.rforge.net/rscript/index.html
Setting up the samples
SmartClientR sample
You can download the sample from here. Unzip it and put the SmartClientR folder into the smartclientSDK/examples/ folder and follow these steps:
1.- Copy the RChartDS.ds.xml file into the smartclientSDK/shared/ds/ folder.
2.- Copy the libraries of Rserve or JRI into the smartclientSDK/WEB-INF/lib/ folder.
3.- Open a console and run:
Windows machine: set path=%path%;C:\Program Files\R\R-2.15.3\bin\(x64 or i386);C:\Program Files\R\R-2.15.3\library\rJava\jri\(x64 or i386) (You need to verify this path in your R installation)
Linux machine: setenv R_HOME /usr/lib64/R (You need to verify this path in your R installation)
4.- If you are going to use Rserve, you'll need to do the following:
Windows machine:
- Run R, once you are in R's console, run these commands:
library(Rserve) (Enter)
Rserve() (Enter)
- Open the embeddedTomcat.bat file located in the smartclientSDK/WEB-INF/bin/ folder. Search this line:
"%JAVA%" -Xmx512m -Duser.timezone=GMT -Djava.awt.headless=true -cp
Add -Dorg.rosuda.jrs.host=localhost before -cp.
- Finally, run embeddedTomcat.bat from the opened console.
Linux machine:
- Run 'R CMD Rserve' from the opened console.
- Open the embeddedTomcat.sh file located in the smartclientSDK/WEB-INF/bin/ folder. Search this line:
$JAVA -Xmx512m -Duser.timezone=GMT -Djava.awt.headless=true -cp
Add -Dorg.rosuda.jrs.host=localhost before -cp.
- Finally, run embeddedTomcat.sh from the opened console.
5.- If you are going to use JRI, you'll need to run the embeddedTomcat.sh/embeddedTomcat.bat file from the opened console.
SmartGwtR sample
You can download the sample from here. Unzip it and put the SmartGwtR folder into the samples/ folder of a SmartGWT SDK.
To run the sample, you need to have ANT configured. Then open a console and run the following:
1.- Copy the libraries of Rserve or JRI into the WEB-INF/lib/ folder of the sample.
2.- Open a console and go to the SmartGwtR folder. Run the following:
Windows machine: set path=%path%;C:\Program Files\R\R-2.15.3\bin\(x64 or i386);C:\Program Files\R\R-2.15.3\library\rJava\jri\(x64 or i386) (You need to verify this path in your R installation)
Linux machine: setenv R_HOME /usr/lib64/R (You need to verify this path in your R installation)
3.- Compile the project by running: ant
4.- If you are going to use Rserve, you'll need to do the following:
Windows machine:
- Run R, once you are in R's console, run these commands:
library(Rserve) (Enter)
Rserve() (Enter)
- Finally, run: 'ant -buildfile build-rserve.xml hosted'.
Linux machine:
- Run 'R CMD Rserve' from the opened console.
- Finally, run: 'ant -buildfile build-rserve.xml hosted'.
5.- If you are going to use JRI, you'll need to run: 'ant -buildfile build-jri.xml hosted'.
Finally, if you are testing the samples on a Windows machine, you'll need to make a change in the RChartDS.ds.xml dataSource. Open it and search '/tmp/', finally replace it with for example: 'c:/myFolder/'.